Note
Go to the end to download the full example code.
1-Dimensional Interpolation
7 import ndsplines
8 import numpy as np
9 import matplotlib.pyplot as plt
10 from scipy import interpolate
11 from scipy.stats import norm
12
13
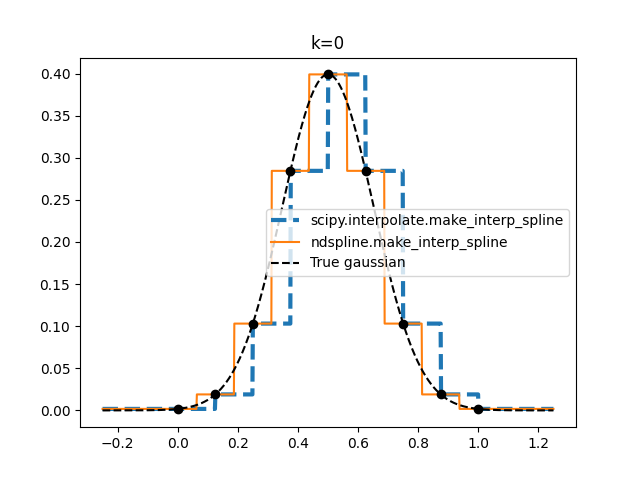
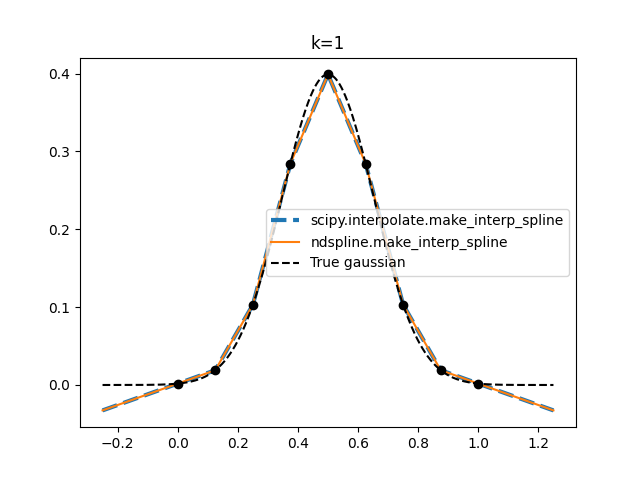
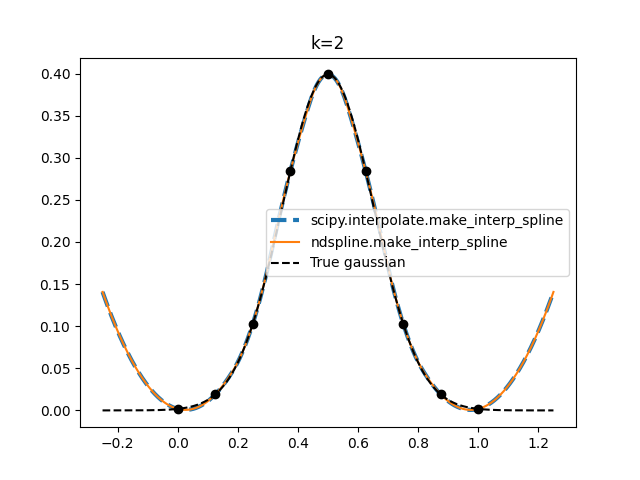
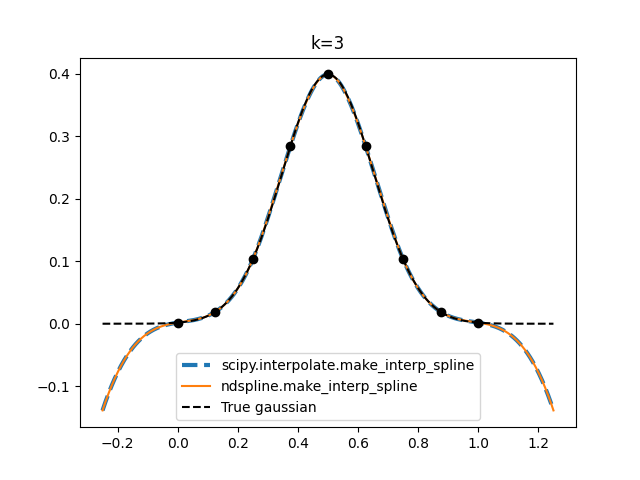
14 def gaussian(x_in):
15 z = norm.ppf(0.9995)
16 x = z * (2 * x_in - 1)
17 return norm.pdf(x)
18
19
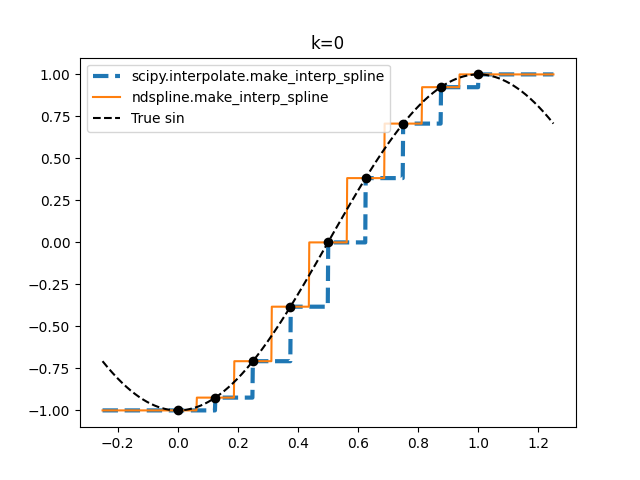
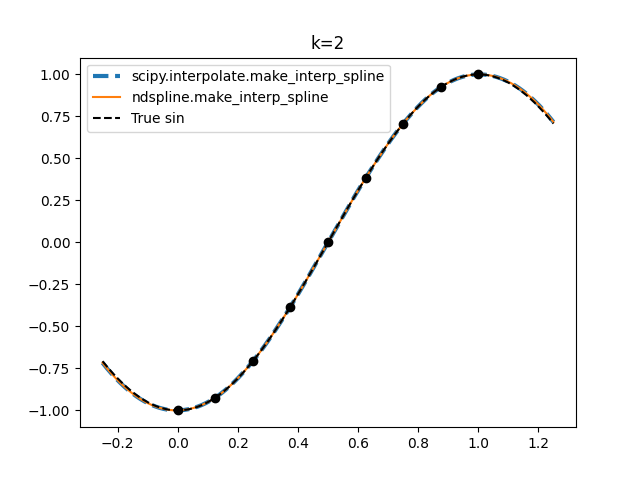
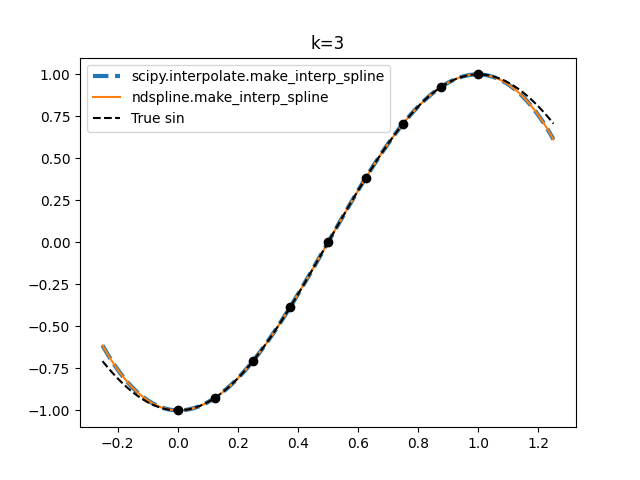
20 def sin(x_in):
21 x = np.pi * (x_in - 0.5)
22 return np.sin(x)
23
24
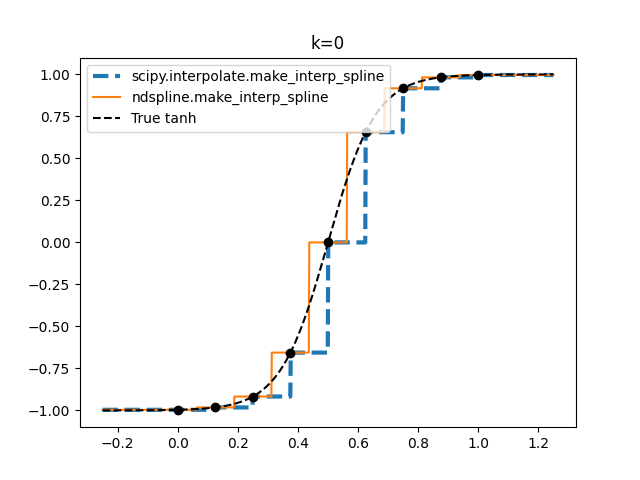
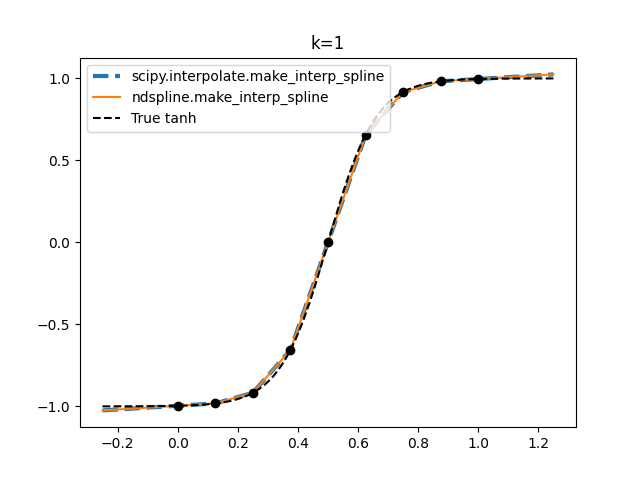
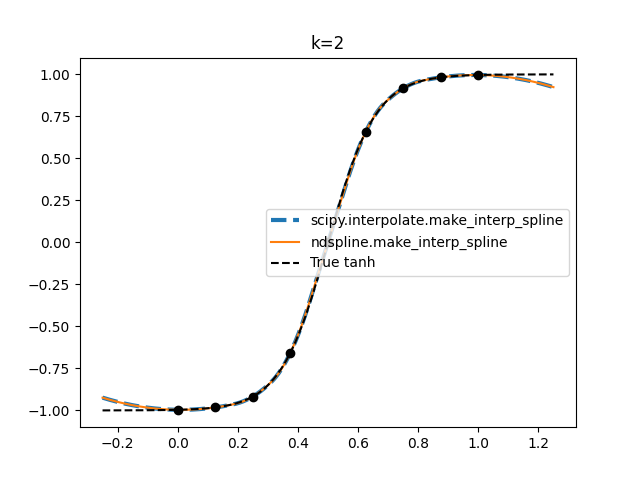
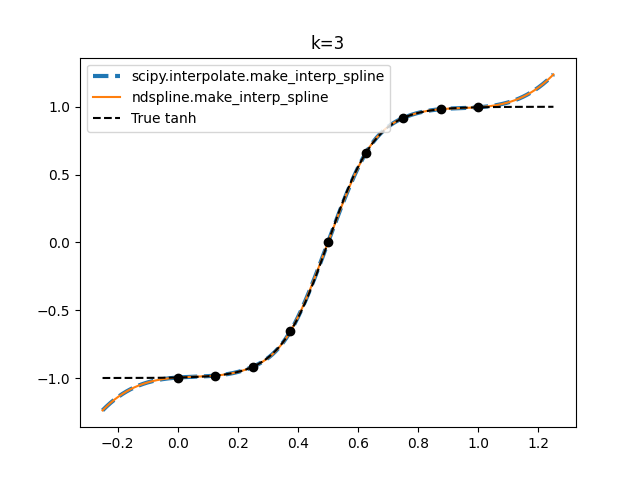
25 def tanh(x_in):
26 x = 2 * np.pi * (x_in - 0.5)
27 return np.tanh(x)
28
29
30 funcs = [gaussian, sin, tanh]
31
32 x = np.linspace(0, 1, 9)
33 xx = np.linspace(-0.25, 1.25, 1024)
34 k = 3
35
36 for degree in range(0, 4):
37 for func in funcs:
38 fvals = func(x)
39 truef = func(xx)
40 plt.figure()
41
42 plot_sel = slice(None)
43
44 plt.gca().set_prop_cycle(None)
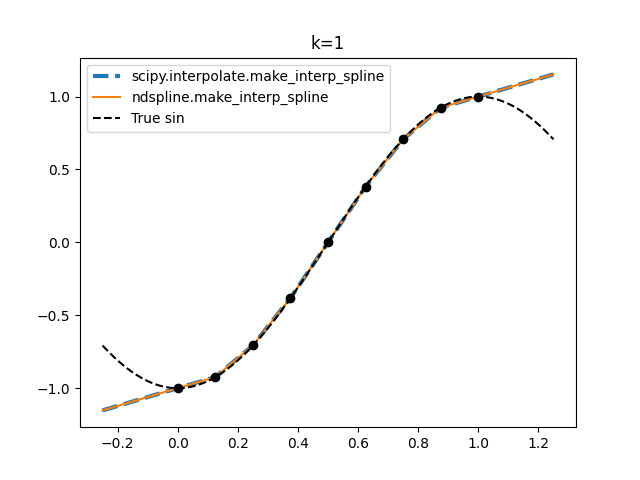
45 test_Bspline = interpolate.make_interp_spline(x, fvals, k=degree)
46 splinef = test_Bspline(xx.copy(), extrapolate=True)
47 plt.plot(
48 xx, splinef, "--", lw=3.0, label="scipy.interpolate.make_interp_spline"
49 )
50
51 test_NDBspline = ndsplines.make_interp_spline(x, fvals, degrees=degree)
52 NDsplinef = test_NDBspline(xx.copy())
53 plt.plot(xx, NDsplinef, label="ndspline.make_interp_spline")
54
55 plt.plot(xx, truef, "k--", label="True " + func.__name__)
56 plt.plot(x, fvals, "ko")
57 plt.title("k=%d" % degree)
58
59 plt.legend(loc="best")
60 plt.show()
Total running time of the script: (0 minutes 0.852 seconds)