Note
Go to the end to download the full example code.
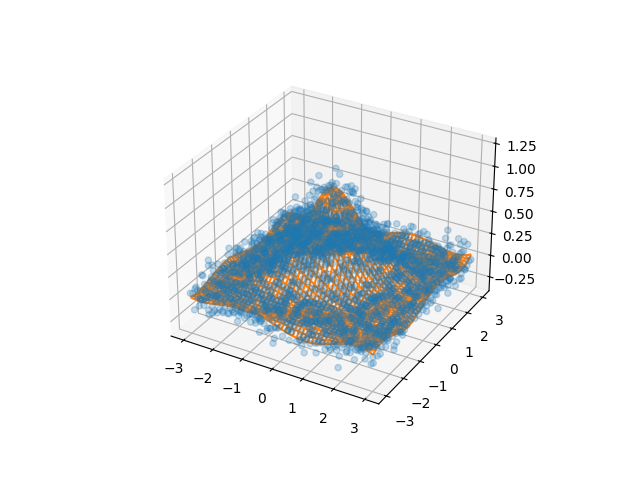
2-Dimensional Least Squares Fit
 7 import ndsplines
 8 import matplotlib.pyplot as plt
 9 import numpy as np
10
11
12 NUM_X = 50
13 NUM_Y = 50
14 x = np.linspace(-3, 3, NUM_X)
15 y = np.linspace(-3, 3, NUM_Y)
16 meshx, meshy = np.meshgrid(x, y, indexing="ij")
17 input_coords = np.stack((meshx, meshy), axis=-1)
18 K = np.array(
19     [
20         [
21             1,
22             -0.7,
23         ],
24         [-0.7, 1.5],
25     ]
26 )
27 meshz = np.exp(
28     -np.einsum(
29         K,
30         [
31             1,
32             2,
33         ],
34         input_coords,
35         [..., 1],
36         input_coords,
37         [..., 2],
38     )
39 ) + 0.1 * np.random.randn(NUM_X, NUM_Y)
40
41
42 xt = [-1, 0, 1]
43 yt = [-1, 0, 1]
44 k = 3
45 xt = np.r_[(x[0],) * (k + 1), xt, (x[-1],) * (k + 1)]
46 yt = np.r_[(y[0],) * (k + 1), yt, (y[-1],) * (k + 1)]
47
48 ts = [xt, yt]
49
50 samplex = input_coords.reshape((-1, 2))
51 sampley = meshz.reshape((-1))
52
53 spl = ndsplines.make_lsq_spline(samplex, sampley, ts, np.array([3, 3]))
54
55 fig = plt.figure()
56 ax = fig.add_subplot(111, projection="3d")
57
58 ax.scatter(meshx, meshy, meshz, alpha=0.25)
59 ax.plot_wireframe(meshx, meshy, spl(input_coords), color="C1")
60 plt.show()
Total running time of the script: (0 minutes 0.118 seconds)