Note
Go to the end to download the full example code.
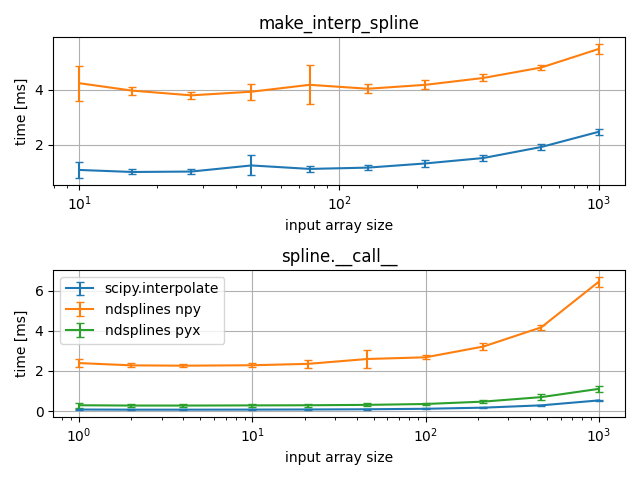
1D ndsplines vs. scipy.interpolate
  7 import numpy as np
  8 import time
  9
 10 from scipy import interpolate
 11 import ndsplines
 12
 13 import matplotlib.pyplot as plt
 14
 15 # number of time measurements per input/query size
 16 n_iter = 10
 17
 18
 19 def timeit(func, n_iter=1, return_samps=True, **func_kwargs):
 20     results = np.empty(n_iter, dtype=np.double)
 21     for i in range(n_iter):
 22         # gc.collect()
 23
 24         tstart = time.time()
 25         func(**func_kwargs)
 26         delta = time.time() - tstart
 27
 28         results[i] = delta
 29
 30     if return_samps:
 31         return results
 32     else:
 33         return np.mean(results)
 34
 35
 36 def gen_xy(size):
 37     x = np.pi * np.linspace(-1, 1, size)
 38     y = np.sin(x)
 39     return x, y
 40
 41
 42 def gen_xx(size):
 43     return 3 * np.pi * np.linspace(-1, 1, size)
 44
 45
 46 # make_interp_spline timing
 47 x_sizes = np.logspace(1, 3, 10, dtype=int)
 48 t_scipy_build = np.empty((2, x_sizes.size))
 49 t_ndspl_build = np.empty((2, x_sizes.size))
 50 for i, size in enumerate(x_sizes):
 51     x, y = gen_xy(size)
 52     t_scipy = 10e3 * timeit(
 53         interpolate.make_interp_spline, x=x.copy(), y=y, n_iter=n_iter
 54     )
 55     t_ndspl = 10e3 * timeit(
 56         ndsplines.make_interp_spline, x=x.copy(), y=y, n_iter=n_iter
 57     )
 58     t_scipy_build[:, i] = np.mean(t_scipy), np.std(t_scipy)
 59     t_ndspl_build[:, i] = np.mean(t_ndspl), np.std(t_ndspl)
 60
 61 # spline query timing
 62 x, y = gen_xy(7)
 63 xx_sizes = np.logspace(0, 3, 10, dtype=int)
 64 t_scipy_call = np.empty((2, xx_sizes.size))
 65 t_ndspl_pyx_call = np.empty((2, xx_sizes.size))
 66 for i, size in enumerate(xx_sizes):
 67     xx = gen_xx(size)
 68     spl_scipy = interpolate.make_interp_spline(x.copy(), y)
 69     spl_ndspl = ndsplines.make_interp_spline(x.copy(), y)
 70     spl_ndspl.allocate_workspace_arrays(size)
 71     t_scipy = 10e3 * timeit(spl_scipy, x=xx.copy(), n_iter=n_iter)
 72     t_ndspl_pyx = 10e3 * timeit(spl_ndspl, x=xx.copy(), n_iter=n_iter)
 73     t_scipy_call[:, i] = np.mean(t_scipy), np.std(t_scipy)
 74     t_ndspl_pyx_call[:, i] = np.mean(t_ndspl_pyx), np.std(t_ndspl_pyx)
 75
 76 # plot results
 77 fig, axes = plt.subplots(nrows=2)
 78
 79 axes[0].errorbar(
 80     x_sizes, t_scipy_build[0], capsize=3, yerr=t_scipy_build[1], label="scipy"
 81 )
 82 axes[0].errorbar(
 83     x_sizes, t_ndspl_build[0], capsize=3, yerr=t_ndspl_build[1], label="ndsplines"
 84 )
 85 axes[0].set_title("make_interp_spline")
 86
 87 axes[1].errorbar(
 88     xx_sizes,
 89     t_scipy_call[0],
 90     capsize=3,
 91     yerr=t_scipy_call[1],
 92     label="scipy.interpolate",
 93 )
 94 axes[1].errorbar(
 95     xx_sizes,
 96     t_ndspl_pyx_call[0],
 97     capsize=3,
 98     yerr=t_ndspl_pyx_call[1],
 99     label="ndsplines pyx",
100 )
101 axes[1].set_title("spline.__call__")
102
103 for ax in axes:
104     ax.set_xlabel("input array size")
105     ax.set_ylabel("time [ms]")
106     ax.set_xscale("log")
107     ax.grid()
108
109 axes[-1].legend()
110 fig.tight_layout()
111
112 plt.show()
Total running time of the script: (0 minutes 0.248 seconds)