Note
Go to the end to download the full example code.
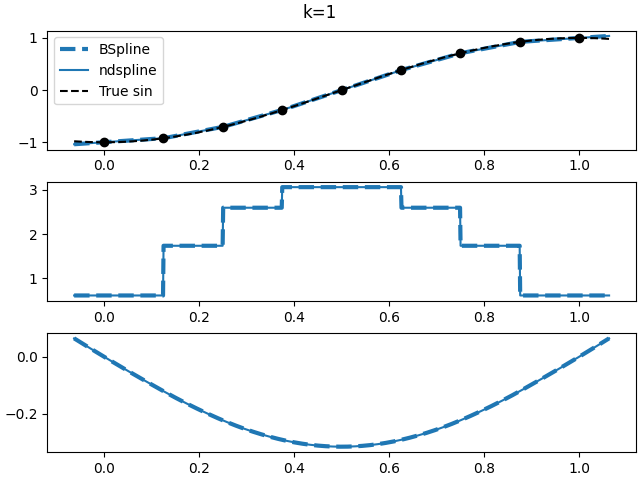
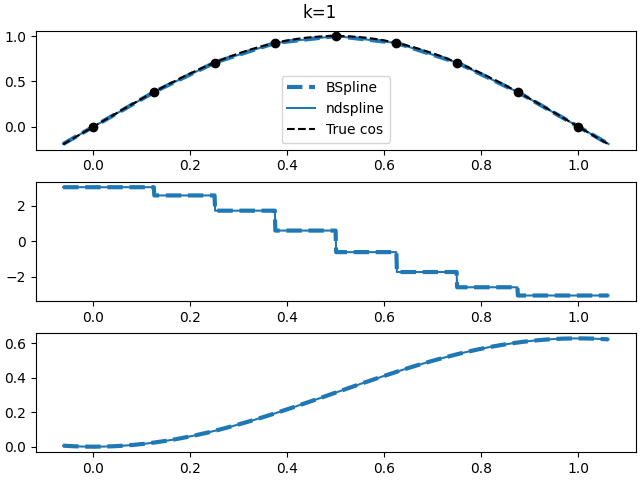
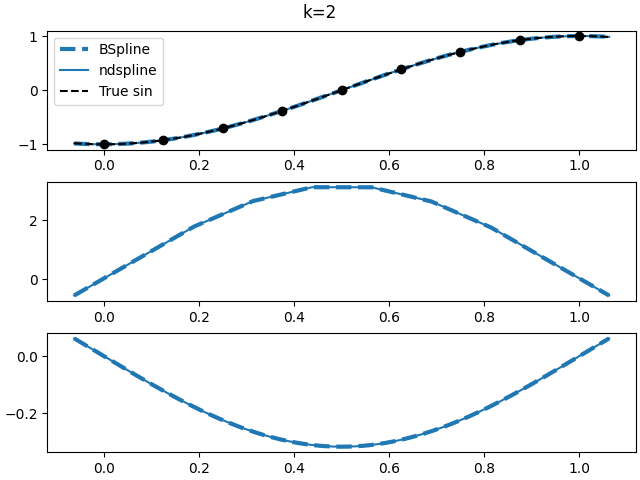
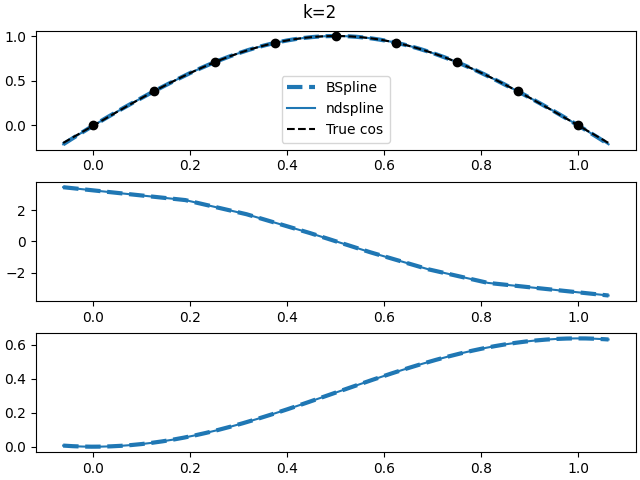
1-Dimensional Derivatives
7 import numpy as np
8 import matplotlib.pyplot as plt
9 from scipy import interpolate
10
11
12 import ndsplines
13
14
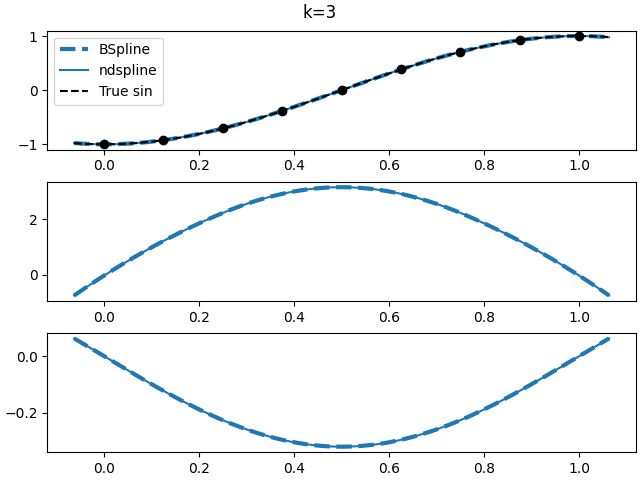
15 def sin(x_in):
16 x = np.pi * (x_in - 0.5)
17 return np.sin(x)
18
19
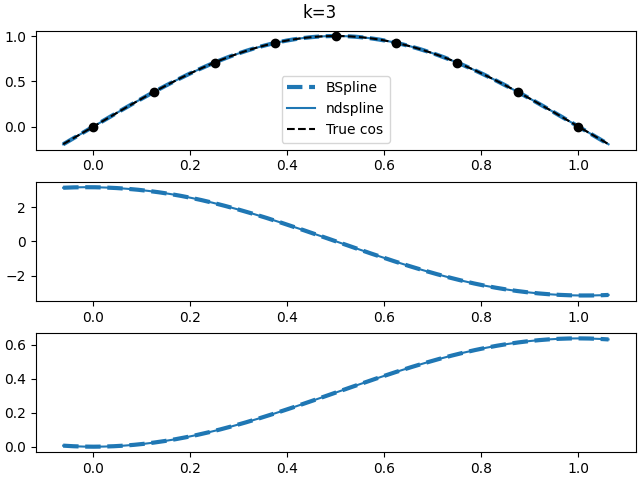
20 def cos(x_in):
21 x = np.pi * (x_in - 0.5)
22 return np.cos(x)
23
24
25 funcs = [sin, cos]
26
27 x = np.linspace(0, 1, 9)
28 xx = np.linspace(-0.0625, 1.0625, 1024)
29 k = 3
30
31 for degree in range(1, 4):
32 for func in funcs:
33 fvals = func(x)
34 truef = func(xx)
35 if degree > 0:
36 fig, axes = plt.subplots(3, 1, constrained_layout=True)
37 else:
38 fig, axes = plt.subplots(2, 1, constrained_layout=True)
39
40 plot_sel = slice(None)
41
42 plt.gca().set_prop_cycle(None)
43 test_Bspline = interpolate.make_interp_spline(x, fvals, k=degree)
44 splinef = test_Bspline(xx.copy(), extrapolate=True)
45 axes[0].plot(xx, splinef, "--", lw=3.0, label="BSpline")
46 if degree > 0:
47 der_Bspline = test_Bspline.derivative()
48 axes[1].plot(xx, der_Bspline(xx.copy()), "--", lw=3.0, label="BSpline")
49 antider_Bspline = test_Bspline.antiderivative()
50 axes[-1].plot(xx, antider_Bspline(xx.copy()), "--", lw=3.0, label="BSpline")
51
52 for ax in axes:
53 ax.set_prop_cycle(None)
54 test_NDBspline = ndsplines.make_interp_spline(x, fvals, degrees=degree)
55
56 NDsplinef = test_NDBspline(xx.copy())
57 axes[0].plot(xx, NDsplinef, label="ndspline")
58 if degree > 0:
59 der_NDspline = test_NDBspline.derivative(0)
60 axes[1].plot(xx, der_NDspline(xx.copy()), label="ndspline")
61 antider_NDspline = test_NDBspline.antiderivative(0)
62 axes[-1].plot(xx, antider_NDspline(xx.copy()), label="ndspline")
63
64 axes[0].plot(xx, truef, "k--", label="True " + func.__name__)
65 axes[0].plot(x, fvals, "ko")
66 plt.suptitle("k=%d" % degree)
67
68 axes[0].legend(loc="best")
69 plt.show()
Total running time of the script: (0 minutes 0.816 seconds)