Note
Go to the end to download the full example code.
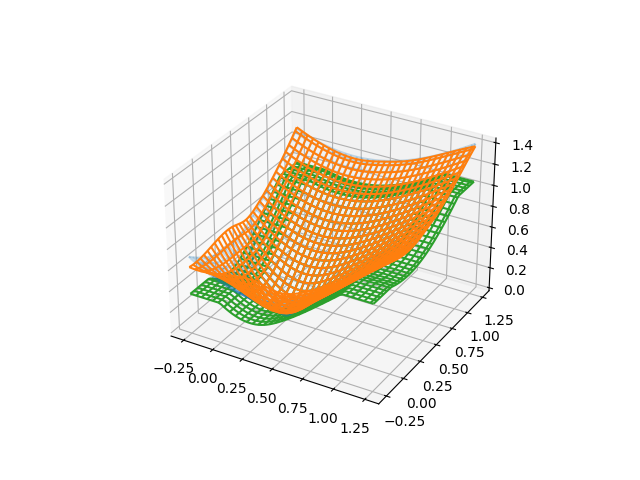
2-Dimensional Interpolation of Tidy Data


True
True
True
True
True
True
True
7 import numpy as np
8 import matplotlib.pyplot as plt
9 from scipy import interpolate
10 from scipy.stats import norm
11
12 import pandas as pd
13
14 import itertools
15
16 import ndsplines
17
18
19 def gaussian(x_in):
20 z = norm.ppf(0.995)
21 x = z * (2 * x_in - 1)
22 return norm.pdf(x)
23
24
25 def sin(x_in):
26 x = np.pi * (x_in - 0.5)
27 return np.sin(x)
28
29
30 def tanh(x_in):
31 x = 2 * np.pi * (x_in - 0.5)
32 return np.tanh(x)
33
34
35 def dist(x_in, y_in):
36 return np.sqrt((x_in - 0.25) ** 2 + (y_in - 0.25) ** 2)
37
38
39 funcs = [gaussian, sin, tanh]
40
41
42 def wrap2d(funcx, funcy):
43 def func2d(x_in, y_in):
44 return funcx(x_in) * funcy(y_in)
45
46 func2d.__name__ = "_".join([funcx.__name__, funcy.__name__])
47 return func2d
48
49
50 funcs = [
51 wrap2d(*funcs_to_wrap)
52 for funcs_to_wrap in itertools.combinations_with_replacement(funcs, r=2)
53 ]
54 funcs.append(dist)
55
56 x = np.linspace(0, 1, 7)
57 y = np.linspace(0, 1, 7)
58
59 xx = np.linspace(0, 1, 64)
60 yy = np.linspace(0, 1, 64)
61
62 xx = np.linspace(-0.25, 1.25, 64)
63 yy = np.linspace(-0.25, 1.25, 64)
64 k = 3
65
66
67 meshx, meshy = np.meshgrid(x, y, indexing="ij")
68 gridxy = np.r_["0,3", meshx, meshy]
69 gridxy = np.stack((meshx, meshy), axis=-1)
70 tidyxy = gridxy.reshape((-1, 2))
71
72
73 meshxx, meshyy = np.meshgrid(xx, yy, indexing="ij")
74 gridxxyy = np.stack((meshxx, meshyy), axis=-1)
75
76 for func in funcs:
77 fvals = func(meshx, meshy)
78 truef = func(meshxx, meshyy)
79
80 tidy_array = np.concatenate(
81 (
82 fvals.reshape((-1, 1)),
83 tidyxy,
84 ),
85 axis=1,
86 )
87
88 tidy_df = pd.DataFrame(
89 tidy_array,
90 columns=[
91 "z",
92 "x",
93 "y",
94 ],
95 )
96 test_NDBspline3 = ndsplines.make_interp_spline(gridxy, fvals[:, :, None])
97 test_NDBspline = ndsplines.make_interp_spline_from_tidy(tidy_df, ["x", "y"], ["z"])
98 test_RectSpline = interpolate.RectBivariateSpline(x, y, fvals)
99 test_NDBspline2 = ndsplines.make_interp_spline_from_tidy(tidy_array, [1, 2], [0])
100
101 print(np.allclose(test_NDBspline2(gridxxyy), test_NDBspline(gridxxyy)))
102
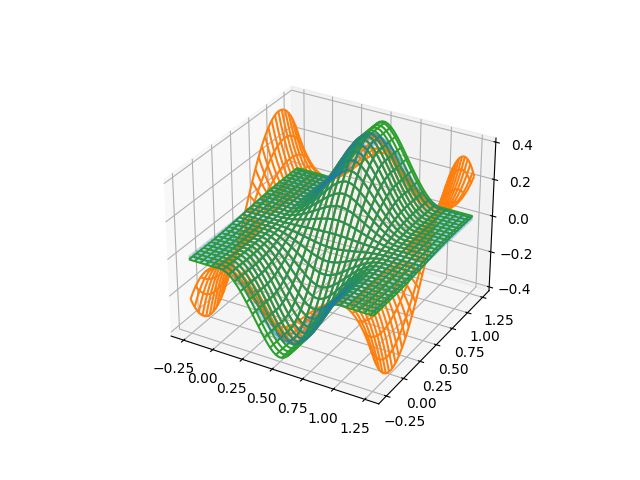
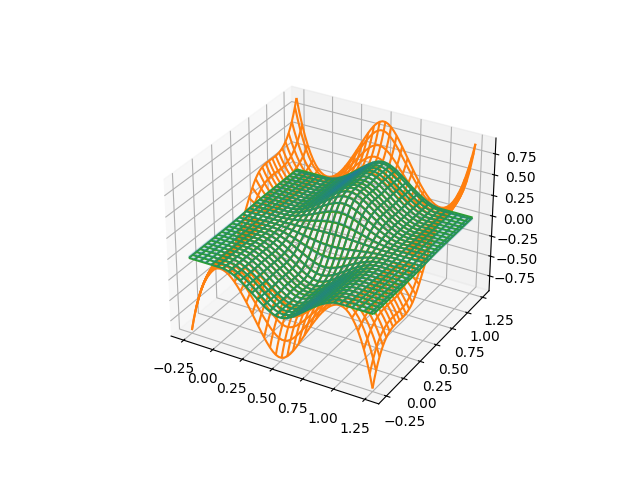
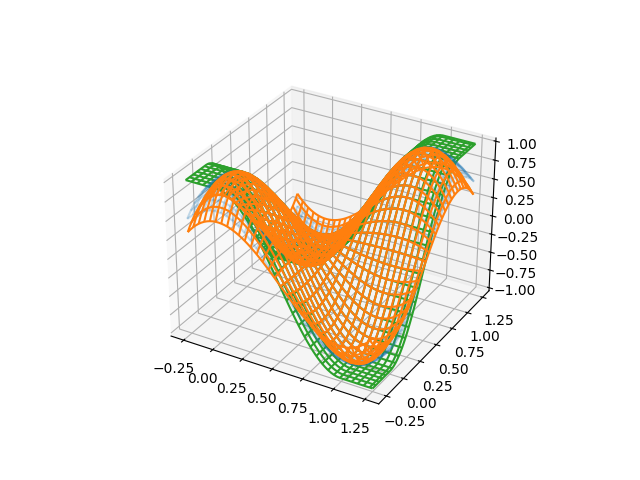
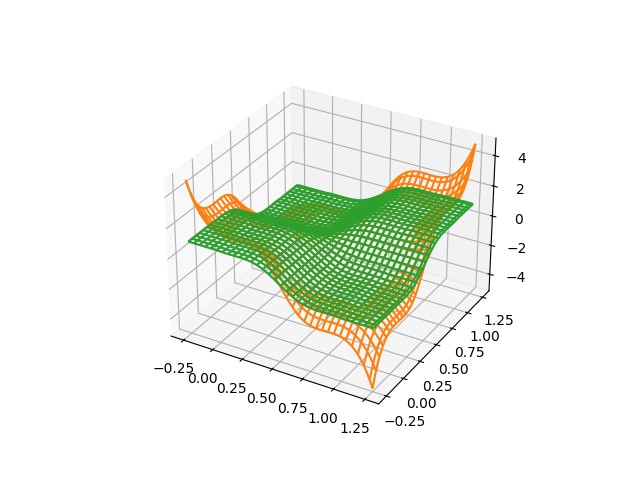
103 fig = plt.figure()
104 ax = fig.add_subplot(111, projection="3d")
105
106 ax.plot_wireframe(meshxx, meshyy, truef, alpha=0.25, color="C0")
107 ax.plot_wireframe(meshxx, meshyy, test_NDBspline(gridxxyy)[..., 0], color="C1")
108 ax.plot_wireframe(
109 meshxx, meshyy, test_RectSpline(meshxx, meshyy, grid=False), color="C2"
110 )
111 plt.show()
Total running time of the script: (0 minutes 0.562 seconds)