Note
Go to the end to download the full example code.
Tutorial for basic usage
[[-3.14159265 -1.          2.        ]
 [-3.14159265 -0.5         2.        ]
 [-3.14159265  0.          2.        ]
 [-3.14159265  0.5         2.        ]
 [-3.14159265  1.          2.        ]
 [-2.74889357 -1.          1.27648914]
 [-2.74889357 -0.5         1.707008  ]
 [-2.74889357  0.          1.94618514]
 [-2.74889357  0.5         1.99402057]
 [-2.74889357  1.          1.85051428]
 [-2.35619449 -1.          0.66312624]
 [-2.35619449 -0.5         1.45862137]
 [-2.35619449  0.          1.90056311]
 [-2.35619449  0.5         1.98895146]
 [-2.35619449  1.          1.72378641]
 [-1.57079633 -1.          0.109375  ]
 [-1.57079633 -0.5         1.234375  ]
 [-1.57079633  0.          1.859375  ]
 [-1.57079633  0.5         1.984375  ]
 [-1.57079633  1.          1.609375  ]
 [-0.78539816 -1.          0.66312624]
 [-0.78539816 -0.5         1.45862137]
 [-0.78539816  0.          1.90056311]
 [-0.78539816  0.5         1.98895146]
 [-0.78539816  1.          1.72378641]
 [-0.39269908 -1.          1.27648914]
 [-0.39269908 -0.5         1.707008  ]
 [-0.39269908  0.          1.94618514]
 [-0.39269908  0.5         1.99402057]
 [-0.39269908  1.          1.85051428]
 [ 0.         -1.          2.        ]
 [ 0.         -0.5         2.        ]
 [ 0.          0.          2.        ]
 [ 0.          0.5         2.        ]
 [ 0.          1.          2.        ]
 [ 0.39269908 -1.          2.72351086]
 [ 0.39269908 -0.5         2.292992  ]
 [ 0.39269908  0.          2.05381486]
 [ 0.39269908  0.5         2.00597943]
 [ 0.39269908  1.          2.14948572]
 [ 0.78539816 -1.          3.33687376]
 [ 0.78539816 -0.5         2.54137863]
 [ 0.78539816  0.          2.09943689]
 [ 0.78539816  0.5         2.01104854]
 [ 0.78539816  1.          2.27621359]
 [ 1.57079633 -1.          3.890625  ]
 [ 1.57079633 -0.5         2.765625  ]
 [ 1.57079633  0.          2.140625  ]
 [ 1.57079633  0.5         2.015625  ]
 [ 1.57079633  1.          2.390625  ]
 [ 2.35619449 -1.          3.33687376]
 [ 2.35619449 -0.5         2.54137863]
 [ 2.35619449  0.          2.09943689]
 [ 2.35619449  0.5         2.01104854]
 [ 2.35619449  1.          2.27621359]
 [ 2.74889357 -1.          2.72351086]
 [ 2.74889357 -0.5         2.292992  ]
 [ 2.74889357  0.          2.05381486]
 [ 2.74889357  0.5         2.00597943]
 [ 2.74889357  1.          2.14948572]
 [ 3.14159265 -1.          2.        ]
 [ 3.14159265 -0.5         2.        ]
 [ 3.14159265  0.          2.        ]
 [ 3.14159265  0.5         2.        ]
 [ 3.14159265  1.          2.        ]]

Coefficients all same? True
Knots all same? True

Antiderivative of derivative:
 Coefficients differ by constant? True
Knots all same? True

Derivative of antiderivative:
 Coefficients the same? True
Knots all same? True
7 import ndsplines
8 import numpy as np
9 import matplotlib.pyplot as plt
10
11 # generate grid of independent variables
12 x = (
13 np.array(
14 [
15 -1,
16 -7 / 8,
17 -3 / 4,
18 -1 / 2,
19 -1 / 4,
20 -1 / 8,
21 0,
22 1 / 8,
23 1 / 4,
24 1 / 2,
25 3 / 4,
26 7 / 8,
27 1,
28 ]
29 )
30 * np.pi
31 )
32 y = np.array([-1, -1 / 2, 0, 1 / 2, 1])
33 meshx, meshy = np.meshgrid(x, y, indexing="ij")
34 gridxy = np.stack((meshx, meshy), axis=-1)
35
36
37 # generate denser grid of independent variables to interpolate
38 sparse_dense = 2**7
39 xx = np.concatenate(
40 [np.linspace(x[i], x[i + 1], sparse_dense) for i in range(x.size - 1)]
41 ) # np.linspace(x[0], x[-1], x.size*sparse_dense)
42 yy = np.concatenate(
43 [np.linspace(y[i], y[i + 1], sparse_dense) for i in range(y.size - 1)]
44 ) # np.linspace(y[0], y[-1], y.size*sparse_dense)
45 gridxxyy = np.stack(np.meshgrid(xx, yy, indexing="ij"), axis=-1)
46
47
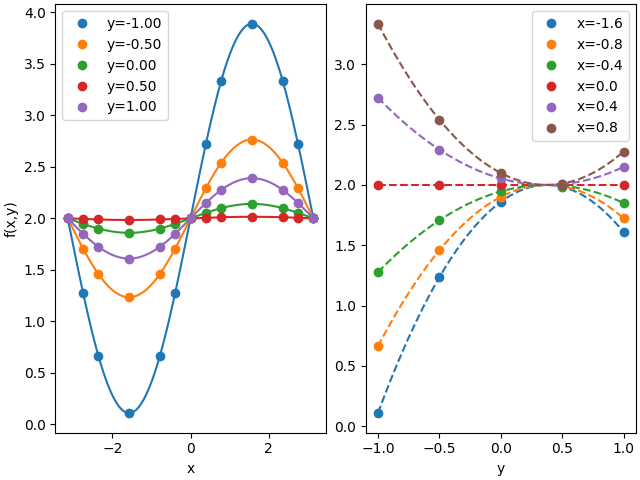
48 def plots(sparse_data, dense_data, ylabel="f(x,y)"):
49 fig, axes = plt.subplots(1, 2, constrained_layout=True)
50 for yidx in range(sparse_data.shape[1]):
51 axes[0].plot(
52 x, sparse_data[:, yidx], "o", color="C%d" % yidx, label="y=%.2f" % y[yidx]
53 )
54 axes[0].plot(
55 xx,
56 dense_data[:, np.clip(yidx * sparse_dense, 0, yy.size - 1)],
57 color="C%d" % yidx,
58 ) # label='y=%.1f'%y[yidx])
59
60 axes[0].legend()
61 axes[0].set_xlabel("x")
62 axes[0].set_ylabel(ylabel)
63 for xidx in range(sparse_data.shape[0] // 2):
64 axes[1].plot(
65 yy,
66 dense_data[(xidx + 3) * sparse_dense, :],
67 "--",
68 color="C%d" % xidx,
69 ) # label='x=%.1f'%x[xidx+3])
70 axes[1].plot(
71 y,
72 sparse_data[xidx + 3, :],
73 "o",
74 color="C%d" % xidx,
75 label="x=%.1f" % x[xidx + 3],
76 )
77
78 axes[1].legend()
79 axes[1].set_xlabel("y")
80 plt.show()
81
82
83 # evaluate a function to interpolate over input grid
84 meshf = np.sin(meshx) * (meshy - 3 / 8) ** 2 + 2
85
86 # create the interpolating splane
87 interp = ndsplines.make_interp_spline(gridxy, meshf)
88
89 # evaluate spline over denser grid
90 meshff = interp(gridxxyy)
91
92
93 plots(meshf, meshff)
94
95
96 ##
97
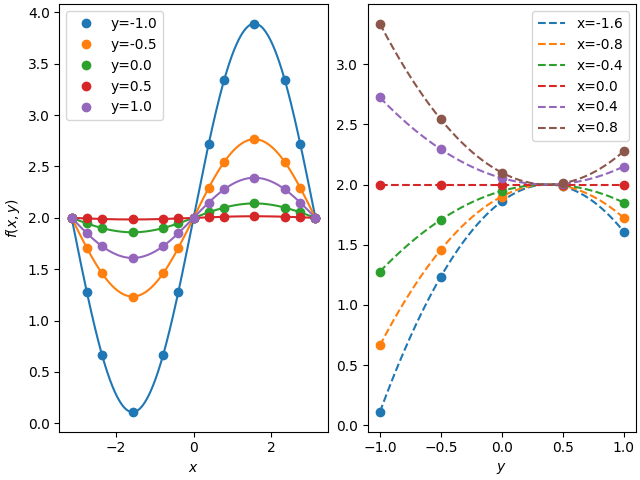
98 # as subplots
99 fig, axes = plt.subplots(1, 2, constrained_layout=True)
100
101 gridxxy = np.stack(np.meshgrid(xx, y, indexing="ij"), axis=-1)
102 meshff = interp(gridxxy)
103
104 for yidx in range(meshf.shape[1]):
105 axes[0].plot(x, meshf[:, yidx], "o", color="C%d" % yidx, label="y=%.1f" % y[yidx])
106 axes[0].plot(xx, meshff[:, yidx], color="C%d" % yidx)
107 axes[0].legend()
108 axes[0].set_xlabel("$x$")
109 axes[0].set_ylabel("$f(x,y)$")
110
111 # y-dir plot
112 gridxyy = np.stack(np.meshgrid(x, yy, indexing="ij"), axis=-1)
113
114 meshff = interp(gridxyy)
115 for xidx in range(meshf.shape[0] // 2):
116 axes[1].plot(
117 yy,
118 meshff[xidx * 1 + 3, :],
119 "--",
120 color="C%d" % xidx,
121 label="x=%.1f" % x[xidx * 1 + 3],
122 )
123 axes[1].plot(y, meshf[xidx * 1 + 3, :], "o", color="C%d" % xidx)
124
125 axes[1].legend()
126 axes[1].set_xlabel("$y$")
127 # plt.ylabel(r'$\frac{\partial f(x,y)}{\partial y}$')
128 plt.show()
129
130 ##
131
132 # we could also use tidy data format to make the grid
133
134 tidy_data = np.dstack((gridxy, meshf)).reshape((-1, 3))
135 print(tidy_data)
136
137 tidy_interp = ndsplines.make_interp_spline_from_tidy(tidy_data, [0, 1], [2])
138
139 print(
140 "\nCoefficients all same?", np.all(tidy_interp.coefficients == interp.coefficients)
141 )
142 print(
143 "Knots all same?",
144 np.all(
145 [
146 np.all(knot0 == knot1)
147 for knot0, knot1 in zip(tidy_interp.knots, interp.knots)
148 ]
149 ),
150 )
151
152 # send to example of least squares
153 ##
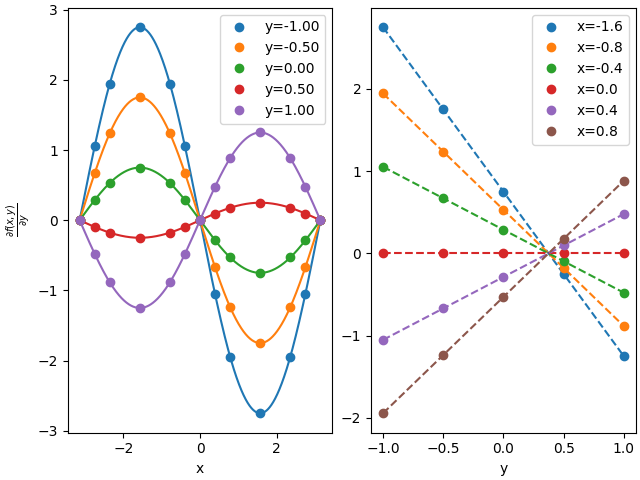
154 # two ways to evaluate derivative - y direction
155
156 deriv_interp = interp.derivative(1)
157 deriv1 = deriv_interp(gridxy)
158 deriv2 = interp(gridxxyy, nus=np.array([0, 1]))
159
160 plots(deriv1, deriv2, r"$\frac{\partial f(x,y)}{\partial y}$")
161
162 ##
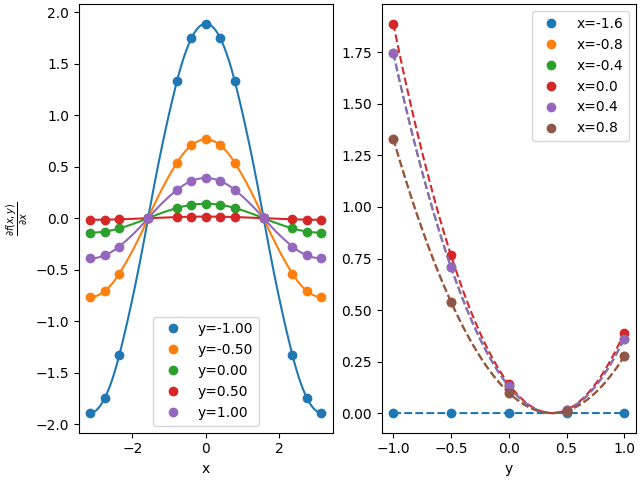
163 # two ways to evaluate derivatives x-direction: create a derivative spline or call with nus:
164 deriv_interp = interp.derivative(0)
165 deriv1 = deriv_interp(gridxy)
166 deriv2 = interp(gridxxyy, nus=np.array([1, 0]))
167
168 plots(deriv1, deriv2, r"$\frac{\partial f(x,y)}{\partial x}$")
169 ##
170
171 # Calculus demonstration
172 interp1 = deriv_interp.antiderivative(0)
173 coeff_diff = interp1.coefficients - interp.coefficients
174 print(
175 "\nAntiderivative of derivative:\n",
176 "Coefficients differ by constant?",
177 np.allclose(interp1.coefficients + 2.0, interp.coefficients),
178 )
179 print(
180 "Knots all same?",
181 np.all(
182 [np.all(knot0 == knot1) for knot0, knot1 in zip(interp1.knots, interp.knots)]
183 ),
184 )
185
186 antideriv_interp = interp.antiderivative(0)
187
188 interp2 = antideriv_interp.derivative(0)
189 print(
190 "\nDerivative of antiderivative:\n",
191 "Coefficients the same?",
192 np.allclose(interp2.coefficients, interp.coefficients),
193 )
194 print(
195 "Knots all same?",
196 np.all(
197 [np.all(knot0 == knot1) for knot0, knot1 in zip(interp2.knots, interp.knots)]
198 ),
199 )
Total running time of the script: (0 minutes 1.372 seconds)